
1. The puzzle behind a dark band
If a protein band looks twice as bright, is there twice as much protein? Not necessarily: once a blot’s signal plateaus, additional sample may barely change the measured intensity. Taylor and colleagues asked how researchers could identify a usable measurement range and whether fluorescent or chemiluminescent detection gave more reproducible results under their experimental conditions. Their test focused on three proteins measured from cell lysate, including two forms that appear at nearly the same position on a blot (1).
2. How were the methods compared?
The researchers made three separate blots from the same pooled breast cancer cell-line lysate, using a series in which each successive lane contained half as much protein. They probed for β-catenin, its phosphorylated form, and α-tubulin. Each membrane received fluorescent detection antibodies alongside antibodies for chemiluminescent detection, allowing comparison on the same membranes. A stain of total transferred protein provided a check on lane patterns and loading. Because the two β-catenin forms overlap in position, detecting both by chemiluminescence also required removing antibodies and probing again (1).
3. What did the dilution series reveal?
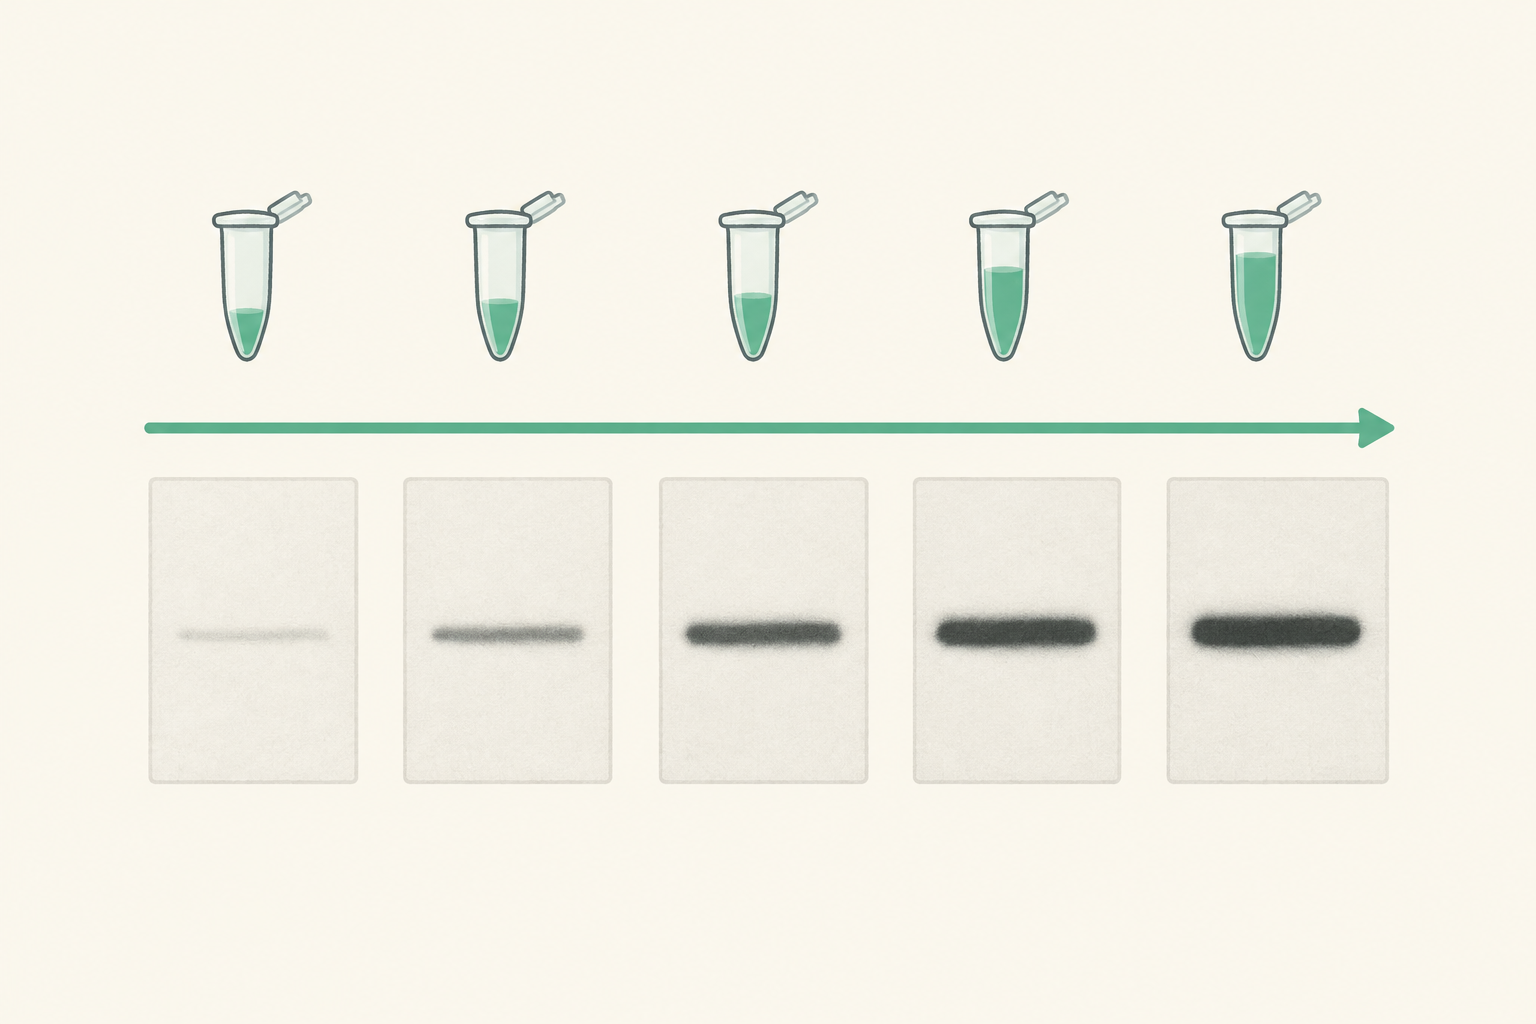
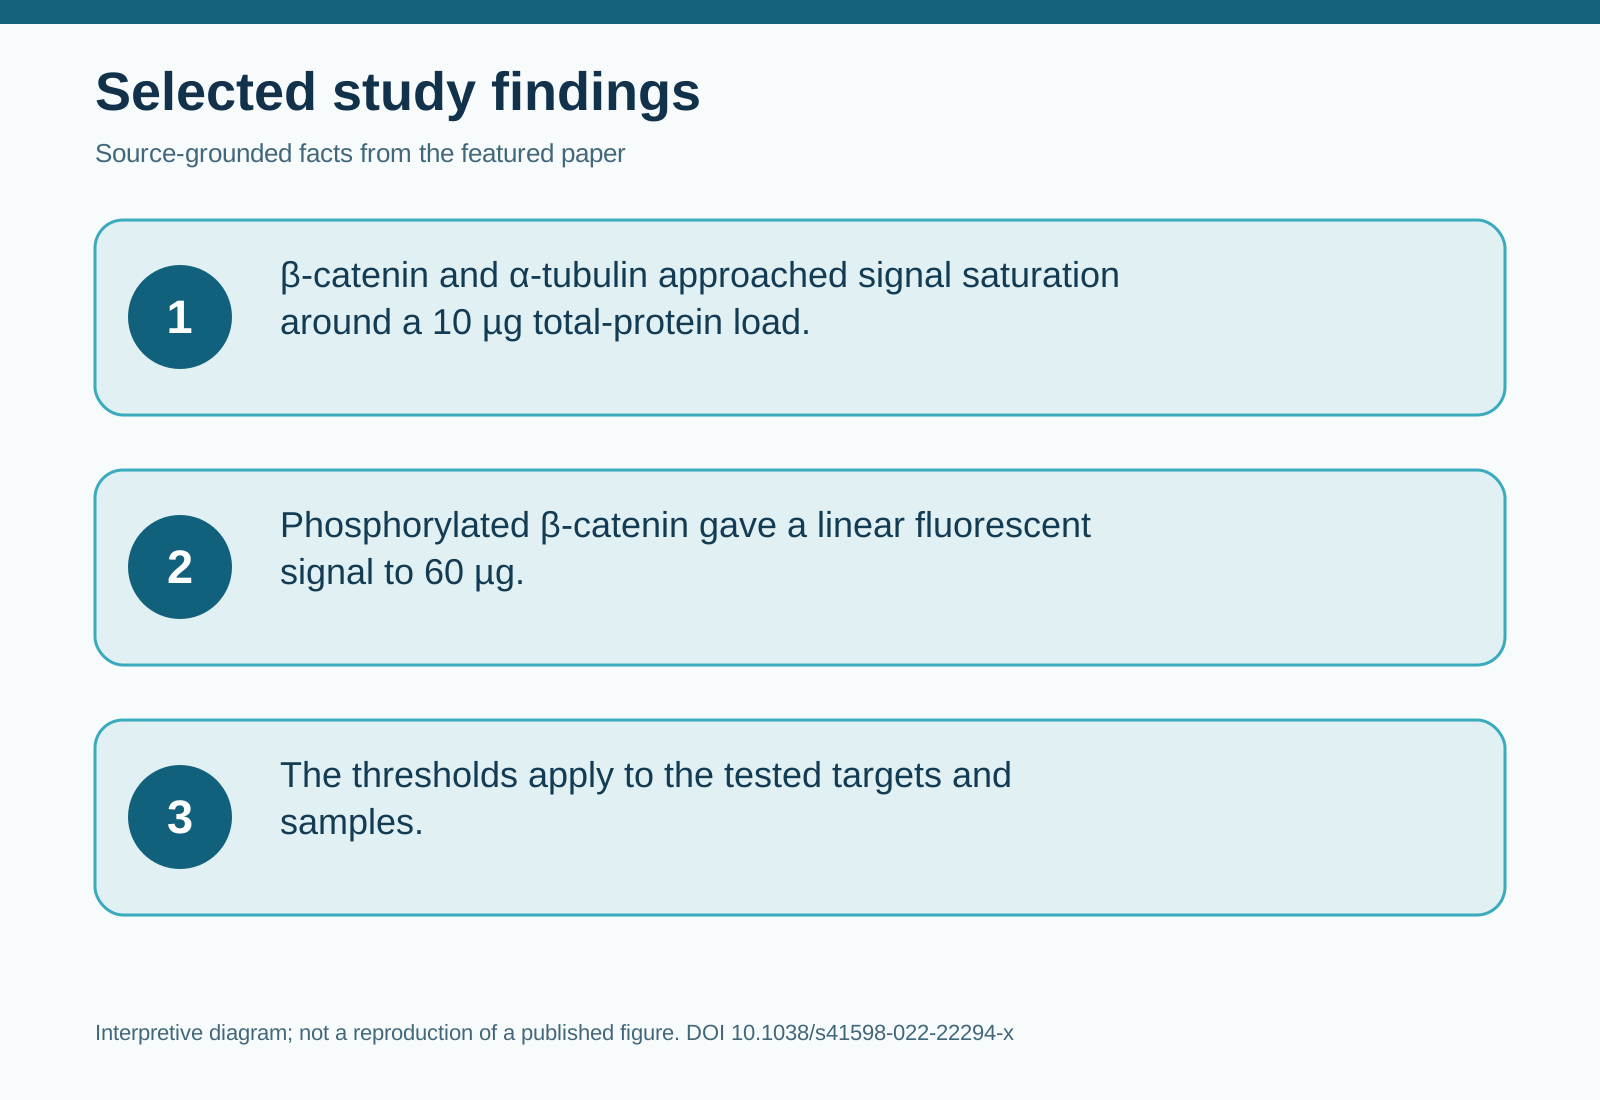
For β-catenin and α-tubulin, signals began to plateau around a 10 µg total-protein load. The less abundant phosphorylated β-catenin remained within the fluorescent method’s linear range up to 60 µg. This measured contrast suggests that one loading amount may not suit even closely related targets; it does not establish universal loading thresholds. For these samples, the authors estimated useful loads of about 2 µg for β-catenin and α-tubulin but about 20 µg for phosphorylated β-catenin (1).
Fluorescent detection distinguished at least two successive halving steps statistically for each of the three targets; chemiluminescence did so only for β-catenin. The phosphorylated target also had a broader linear range with fluorescence, while the ranges for the other two targets were similar between methods. The authors infer that fluorescence offered greater precision in this comparison. More detectable differences across these dilutions do not, by themselves, prove that fluorescence is always the more accurate method (1).
4. What changes in the workflow?
The authors propose testing a dilution series made from pooled experimental samples before choosing a load for each target. They also recommend checking transferred total protein for sample quality and using a loading measure that, like the target, remains within its linear range. When samples span multiple blots, a shared pooled control can help compare measurements across them. These steps address a practical problem: a clean-looking band can still be unsuitable for quantification (1).
5. Limitations and uncertainty
The comparison used three blots prepared from one pooled cell-line lysate, not independent biological samples across tissues or treatments. Antibody choice, target abundance, detection conditions and stripping could affect the results elsewhere. Because chemiluminescent measurement of both overlapping forms involved stripping and reprobing, this experiment does not isolate detection chemistry from every added processing step. The authors’ suggested loads are specific to their samples and targets (1).
6. Takeaway
Before comparing protein abundance, ask whether both the target signal and its loading measure still respond to added protein. A target-specific dilution series can answer that question more reliably than band darkness alone (1).
7. References
(1) Taylor SC, Rosselli-Murai LK, Crobeddu B, Plante I. A critical path to producing high quality, reproducible data from quantitative western blot experiments. Scientific reports. 2022;12:17599. doi:10.1038/s41598-022-22294-x.
8. Topics
#WesternBlotting #ProteinQuantification #FluorescenceDetection #ResearchMethods